

Industry
Turn plant data into steady, safer yield.
We build process data, batch and plant software for chemicals and process industries, connecting the historian and control layer to the analytics that lift yield, quality and reliability.
Overview
Process plants live or die on consistency. A yield that drifts, a batch that fails quality, an unplanned shutdown or an energy bill creeping upward all trace back to the same thing: not enough clear sight of what the process is really doing. The data exists, in the historian, the DCS and the lab, but it rarely sits where the people who could act on it can see it together. We build the software that brings process data into one place and turns it into decisions about yield, quality, reliability and cost.
Whether you run continuous or batch, the value is locked behind integration. Historians and distributed control systems hold years of high-resolution signal, quality and batch systems hold the rest, and the two seldom meet. We specialise in joining them safely: pulling process data out without disturbing control, aligning it with batch and quality records, and presenting it so engineers can see cause and effect rather than guess at it. That is what makes yield analysis, golden-batch comparison and early fault detection possible instead of theoretical.
We work end to end: we advise, we build and we run. In process industries the sequence and the safety case matter as much as the code, so many engagements start with advice about what to measure, what to integrate and where the real losses are. We build the pieces that clearly earn their place, from batch record and quality tools to process analytics and energy dashboards, and, if you want, we stay on to run them. Environmental, health and safety obligations run through all of it, so we treat compliance evidence as something the system produces naturally, not something reconstructed under audit pressure.
Our founders come from heavy industry: oil and gas, mining, manufacturing and logistics. Process plants are close cousins to that world, the same reality of continuous operation, hazardous materials, long-lived assets and control systems that cannot be casually rebooted. We bring that discipline about risk, sequencing and evidence to every engagement. With offices in Pune, Bengaluru and Indore, we combine strong Indian engineering depth with the delivery standards a safety-critical plant demands.
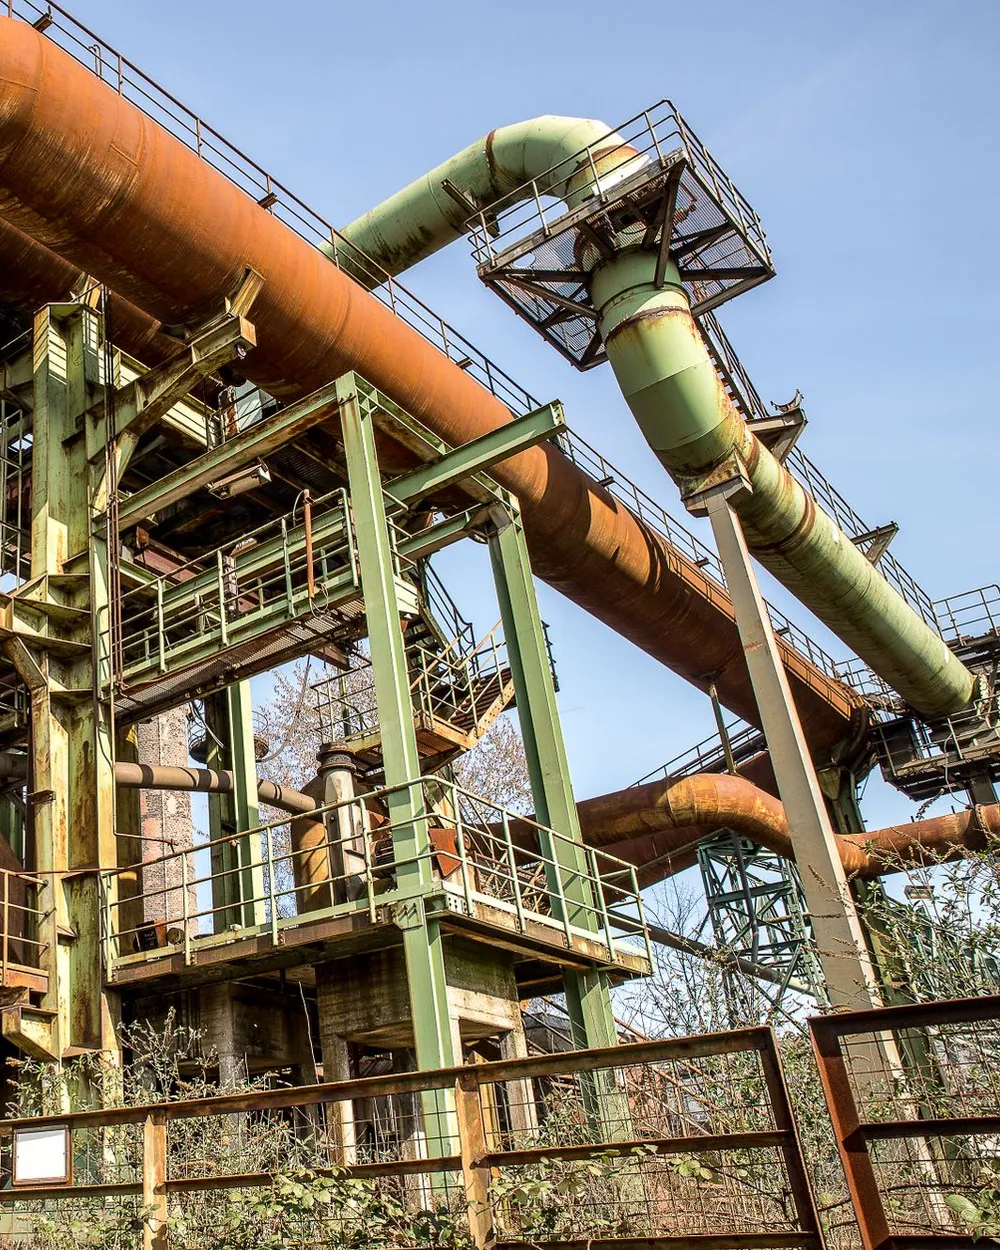
The reality
What we hear from chemicals & process teams.
Process data buried in historians and the DCS, out of reach of the engineers who need it.
Yield and quality that drift without a clear, data-backed reason why.
Batch and quality records kept on paper or in silos, slow to compile and hard to audit.
Unplanned downtime because asset and process warning signs are spotted too late.
Energy a major cost, yet poorly measured and rarely optimised at the process level.
EHS and regulatory reporting that consumes time because the evidence is scattered.
How we help
Software and data, built for chemicals & process.
Historian & DCS Integration
Safe, resilient links between the control and historian layer and your enterprise systems, so high-resolution process data becomes usable for analytics and reporting without disturbing control.
Process & Yield Analytics
Analytics that expose what actually drives yield and quality, comparing runs against your best batches so engineers tune the process on evidence rather than instinct.
Electronic Batch Records
Batch and quality records captured as the process runs, structured, searchable and audit-ready, replacing paper and spreadsheets with a single reliable source of truth.
Plant Reliability
Asset and condition monitoring that turns process and equipment signals into earlier warning, so maintenance is planned around real risk rather than around unplanned failure.
EHS & Compliance
Tools that keep environmental, health and safety evidence current and close at hand, so reporting is a by-product of running the plant well rather than a scramble before an audit.
Energy Optimisation
Measurement and analytics at the process level that make energy visible where it is used, so you can find the waste and cut cost without compromising output or safety.
How we work
People who have worked your world, not just read about it.
Understand the process
We learn how your plant runs, where the losses in yield, quality, uptime and energy sit, and where the data lives, with full respect for the safety-critical setting.
Connect the data
We integrate the historian, DCS, batch and quality systems safely, so process data can be analysed and reported without touching the control layer that keeps the plant stable.
Build what pays back
We deliver the analytics, records and reliability tools that clearly improve yield, quality, uptime or cost, and we avoid adding software that does not earn its keep.
Run and refine
If you want, we operate and improve the systems with you, keeping them dependable as the process, the products and the regulations change.
- 1 to 3%
- Representative yield gain from tighter process visibility
- Paper-free
- Batch and quality records made audit-ready
- Fewer stops
- Earlier warning on reliability and process risk
FAQ
Questions we hear a lot.
What is the difference between batch and continuous process software?
Continuous processes run steadily and are managed around holding the process within a stable window, so the software leans on real-time signal, trends and deviation detection. Batch processes run in discrete steps, so the software centres on the recipe, the batch record and comparing one run against another. Many plants do both, and we build for whichever mix you run, with the historian and quality data joined so either style can be analysed properly.
Can you integrate our historian and DCS without disrupting the plant?
Yes, and doing it without disruption is the whole point. We do not ask you to change the control layer. We draw data out safely, alongside the systems that keep the process stable, and feed it into places where it can drive yield, quality, reliability and energy decisions. The control environment stays as protected as it needs to be while the value on top of it grows.
How does process analytics improve yield and quality?
Most yield and quality loss has a cause hidden in the data: a drifting parameter, an input variation, a step that ran slightly out of its ideal window. Process analytics brings historian, batch and quality data together and compares runs against your best outcomes, so engineers can see what separates a good batch from a poor one and act on it. Even modest, sustained gains of one to three percent add up quickly at plant scale.
Do you understand EHS and regulatory requirements in process industries?
Our founders come from oil and gas, mining and heavy manufacturing, where hazardous materials, strict safety rules and hard reporting obligations are the daily reality. Process industries sit right beside that experience. We design so that environmental, health and safety evidence is captured as the plant runs, which means reporting draws on data that is already there rather than being reconstructed under audit pressure.
Working in Chemicals & Process? Let's talk.
Tell us what you are trying to fix. We will tell you how we would approach it, and whether software is even the right answer.